
A question about octave smoothing


Thread Starter
500 Watt CAFz'r
Joined: May 2000
Posts: 871
When reviewing the horizontal off-axis frequency response of a speaker, the reviewer will plot several graphs of SPL-dB (Y axis) vs. Frequency-Hz (X axis). There will be several graphs, each representing the various placement of the microphone off axis.
The reviewer then says that one-tenth-octave smoothing was used in all the following curves.
What is one-tenth-octave smoothing?
Why do it?
How is it done?
Thanks...Keith.
The reviewer then says that one-tenth-octave smoothing was used in all the following curves.
What is one-tenth-octave smoothing?
Why do it?
How is it done?
Thanks...Keith.

Yankee


Joined: Oct 2003
Posts: 3,599
I don�t know for certain, this sounds like a job for DAVE! Here is my SWAG (Scientific Wild Azz Guess):
Sounds like the performance plot described is derived over a freq band to develop a 2D plot of speaker 'directionality' over a variety of frequencies. Every 1/10 octave the performance is verified to assure accuracy and to account for data scatter. The mic is moved on the horizontal plane in front of the speaker but the height remains constant.
Sounds like the performance plot described is derived over a freq band to develop a 2D plot of speaker 'directionality' over a variety of frequencies. Every 1/10 octave the performance is verified to assure accuracy and to account for data scatter. The mic is moved on the horizontal plane in front of the speaker but the height remains constant.
Yankee
Joined: Oct 2003
Posts: 3,599
Q- Why is it done?
A- someone wants the info, duh
Q- How is it done?
A- Algorithms (software programs) are generally used now, but it could be done manually. This sounds like a scientific process but it really is statistics modeling (ewwwww). And the resulting plot may be based on median, average, exponential, distance or whatever technique makes sense for the data being gathered.
This technique of applying algorithms is not limited to 2D modeling it is easily capable of 3D modeling and with the correct programming can determine how a speaker would perform in a given space over its frequency spectrum (predictive modeling).
[img]graemlins/boring.gif[/img]
Guest
Posts: n/a
You rang??? just kidding..
Off-axis response graphs are created to show a speakers radiation pattern.
Sometimes good off-axis response is a blessing, and sometimes it's detrimental, in a car. In the home, even radiation would be better, since it reduces the size of the 'sweet spot'.
How, what is 1/10 octave smoothing? Basically, they measure the output level of the driver (in decibels) in steps of 1/10th octave steps. So, ten times, at even intervals, per octave. So, ten points from 20Hz to 40Hz, ten points from 40Hz to 80Hz and so on... It all adds up to very accurate information.. When I do my frequency sweeps, I use 1/12 octave steps, because that's what my Carmeter does...(or full octave, 1/3 octave or 1/6 octave)...
Why is it done? It can reveal beaminess caused by operating a driver above it's intended frequency range. When cones are operated at higher frequencies than intended, the cone itself resonates and all sorts of very bad sounds are created. It can also show off dispersion problems caused by phsycial driver design. Multiple drivers in a co-axial alignment may have specific characteristics, and so on. In a magazine like Stereophile, they are commonly looking for 'size' of the drivers sweet spot.
How do they do it. In an ideal world, a speaker assmebly would be taken in an anechoic chamber and mounted on a motorized rotating platform. A microphone is placed at a specific distance from the speaker (commonly 1-meter, but I don't know why). A frequency response test is performed and recorded, then the driver is rotated and the test is repeated. For the test to be accurate, the front plane of the speaker needs to be in the center of the rotating drum such that the distance from the drivers remains constant.
I think it was in the recent Car Audio and Electronics magazine with the high-end speaker reviews that one of the drivers tested showed a marked drop in SPL in the midrange. Personally, this looks more like a measurement error as it's almost always high frequency performance that is affected by off-axis testing.
This is a sample from a Stereophile review of the Polk LSi7, the little brother to the speakers I am likely going to be purchasing shortly. This is the
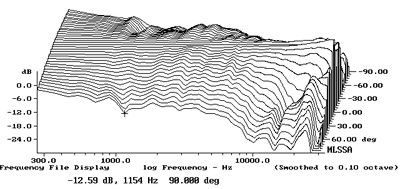
You can see that by 30 degree's out, the output at 20kHz is down by about 30dB.
This is the same graph, but for the vertical axis (above and below the tweeter). There's a clear dip that varies from 2kHz to 2.5kHz of about 6dB. This is most like an effect of the crossover point and shows the interaction of the midrange and tweeter.
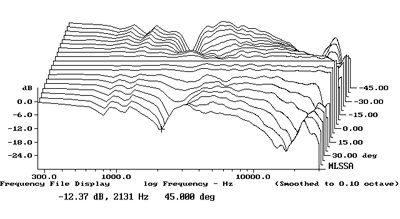
Actually, as luck would have it, proof of my hypothesis can be found in this graph...
Hope that helps a bit..
Off-axis response graphs are created to show a speakers radiation pattern.
Sometimes good off-axis response is a blessing, and sometimes it's detrimental, in a car. In the home, even radiation would be better, since it reduces the size of the 'sweet spot'.
How, what is 1/10 octave smoothing? Basically, they measure the output level of the driver (in decibels) in steps of 1/10th octave steps. So, ten times, at even intervals, per octave. So, ten points from 20Hz to 40Hz, ten points from 40Hz to 80Hz and so on... It all adds up to very accurate information.. When I do my frequency sweeps, I use 1/12 octave steps, because that's what my Carmeter does...(or full octave, 1/3 octave or 1/6 octave)...
Why is it done? It can reveal beaminess caused by operating a driver above it's intended frequency range. When cones are operated at higher frequencies than intended, the cone itself resonates and all sorts of very bad sounds are created. It can also show off dispersion problems caused by phsycial driver design. Multiple drivers in a co-axial alignment may have specific characteristics, and so on. In a magazine like Stereophile, they are commonly looking for 'size' of the drivers sweet spot.
How do they do it. In an ideal world, a speaker assmebly would be taken in an anechoic chamber and mounted on a motorized rotating platform. A microphone is placed at a specific distance from the speaker (commonly 1-meter, but I don't know why). A frequency response test is performed and recorded, then the driver is rotated and the test is repeated. For the test to be accurate, the front plane of the speaker needs to be in the center of the rotating drum such that the distance from the drivers remains constant.
I think it was in the recent Car Audio and Electronics magazine with the high-end speaker reviews that one of the drivers tested showed a marked drop in SPL in the midrange. Personally, this looks more like a measurement error as it's almost always high frequency performance that is affected by off-axis testing.
This is a sample from a Stereophile review of the Polk LSi7, the little brother to the speakers I am likely going to be purchasing shortly. This is the
You can see that by 30 degree's out, the output at 20kHz is down by about 30dB.
This is the same graph, but for the vertical axis (above and below the tweeter). There's a clear dip that varies from 2kHz to 2.5kHz of about 6dB. This is most like an effect of the crossover point and shows the interaction of the midrange and tweeter.
Actually, as luck would have it, proof of my hypothesis can be found in this graph...
Hope that helps a bit..
Yankee
Joined: Oct 2003
Posts: 3,599
See I told you DAVE was the man on this Question!
Dave are those Melissa plots?
We have a vendor developing a predictive model of sound intensity using simular info. Very high priced stuff to develop, and the results have yet to be verified.
Dave are those Melissa plots?
We have a vendor developing a predictive model of sound intensity using simular info. Very high priced stuff to develop, and the results have yet to be verified.
Guest
Posts: n/a
MLSSA Waterfall plots are quite different. They are a measurement of frequency response vs amplitude vs time to show the decay and resonance characteristics of a speaker.
There are two types. One of the drivers acoustical output, and one taken with a transducer attached to the speaker cabinet to look for resonances.
Again, here is a plot, stolen from Stereophiles website of the Polk LSi7's cumulative spectral decade plot.
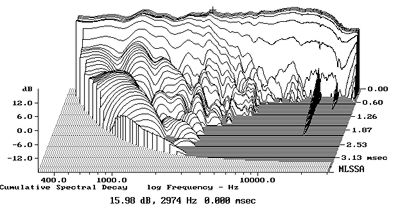
In simple terms, this shows how quickly sound stops coming from a speaker once the signal has stopped. Faster is better.
This is a similarly created plot from the Canadian made Totem Forest. Not sure what all the enery at 25kHz is about, but it sure is above the range of human hearing.. You can see that the this second example dies out much faster that the Polk. Not a knock at the little Polk, but a compliment to the design of the Totem.

These measurements can help better describe the 'sound' of a speaker..
There are two types. One of the drivers acoustical output, and one taken with a transducer attached to the speaker cabinet to look for resonances.
Again, here is a plot, stolen from Stereophiles website of the Polk LSi7's cumulative spectral decade plot.
In simple terms, this shows how quickly sound stops coming from a speaker once the signal has stopped. Faster is better.
This is a similarly created plot from the Canadian made Totem Forest. Not sure what all the enery at 25kHz is about, but it sure is above the range of human hearing.. You can see that the this second example dies out much faster that the Polk. Not a knock at the little Polk, but a compliment to the design of the Totem.
These measurements can help better describe the 'sound' of a speaker..

1000 Watt CAFz'r
Joined: Oct 2003
Posts: 1,783
Dave, that was an incredible post.
The initial question about "smoothing" was missed though.
Manufactures use some extremely high sampling rates when measuring speakers sometimes. For example, a 100 point per octave test. The graphed response is often very jagged, looking like a high frequency wave form over the curve of the graph. Smoothing is used to average the response down to something much more pleasing and easily understood by the eye. A common one is 1/3 octave smoothing for example.
Hope that helps.
Dave, again great post [img]graemlins/thumb.gif[/img]
Adam
1000 Watt CAFz'r
Joined: Oct 2003
Posts: 1,783
I'm having a lot of fun with the car.
Last time I was home, I finished the main build out sections on the doors that mount the midbass drivers. And, completed the sound deadening and mounting of the door skins. It sounds simple, but there was a lot of clearancing issues. I've got a lot of pics of the whole process, but I haven't got them uploaded to the net yet. The car will eventually have it's own website, with an in narrative of the project.
I also went through 3 sets of tweeters, basically doing a lot of listening(no I didn't blow any of them). I had the Focal TN51 to start, moved to a Vifa tweeter, and finally a set of Morels. I'm probably going to order a set of DLS UR-1 tweeters to try soon as well.
I"m waiting for warmer weather to start RTA work in the car, as the cold changes the drivers' tonal characteristics. I'll probably get the Audio Control remote faceplate for my DQX. Once I have the car built, I"m going to build EQ settings to compensate for different ambient temperatures throughout the year. Got to love non-volitile memories!
I built some temparary baffles to start playing with midrange angles and positioning in the kick area. After running just the midrange driver by itself, I found a whole bunch of issues that I hadn't considered before. Lots more work to do to figure them out. Mostly due to baffle resonance and under dash reflections, but I'm also looking at ways to minimize back waves from hitting the backside of the speaker cone. Those Utopia drivers are incredible, but the installation can kill them. Dawgsbreakfast has been throwing me all kinds of cool ideas, and I've got a full test programe scheduled for the spring with the RTA in the car. I'm going to actually mount a PC in the car to run the Linear X LMS RTA. I've got that many tests to do!
And finally, I've been chasing little rattles and squeeks throughout the car. Considering I've in some way changed the mounting surfaces of just about every panel inside the car, I'm doing pretty good. It's a pretty dead car right now, and it's getting quieter. I can run my 2500 watt system full volume, and outside the car it's pretty silent. Yes you can hear it outside, but you'd never know how loud it was inside the car. My biggest polluter of noise outside the car is my 6.5 inch mids that are currently shaking the hell out of my door frames.
Adam


